
Perth Inflation and property Prices
The Reserve Bank of Australia inflation calculator shows that inflation in Australia from 2015 to 2023 was 2.81%. We’ve taken a look at a sample of 5 random suburbs in Perth broadly representing the different priced markets and have compared growth in these suburbs to the national inflation rates to see if we’re lagging, on track or ahead of inflation.
We know long term property growth in Australia typically outstrips inflation by around 3% so this will give us a clue about where we are in the property growth cycle in Western Australia.

We can see that actual median prices in 2023 were $379,553 for Balga and $614,209 for Wilson, which are below where they should be if they had kept up with inflation. If they had grown in line with inflation the Balga median would have been $511,922 in 2023 and the Wilson median would have been $740,440. Their compound annual growth rates from 2015 to 2023 were -0.96% for Balga and 0.44% for Wilson, well below the 2.81% inflation rate. Doubleview is slightly behind inflation but not by much, and Applecross and Dalkeith are approximately in line with inflation.
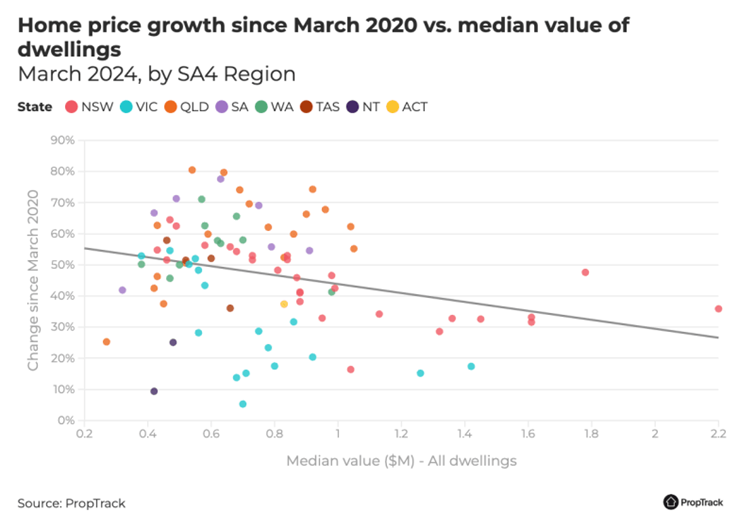
This is echoed by the above Prop Track chart which shows the suburbs at the lower end of median prices have experienced the highest growth since March 2020.
We’ve seen this across the lower value suburbs in WA in the last 18 months, some of them such as Mandurah and Armadale have grown close to 70%! Some of these suburbs you could previously buy an established house on a full block of land for cheaper than you could build a new house excluding the land.
This massive growth is a catch up for the prior decade of minimal growth in what we call “regression to the mean”, which means we typically see the average growth rates across the country revert back to the average growth rate of 7-8% per annum.
According to our calculations, Western Australia is just past halfway on this catch up where we will revert back to the long term average growth rate of 7-8%, so we still have a couple of years of good growth ahead of us.
Post script; the reason we have compared 2015 to 2023 rather than 2014 to 2024 is because the suburb median data is readily available from www.onthehouse.com.au going back to 2015 and the inflation rates are released by the RBA annually, so 2024 rates haven’t been released yet.